Residenzlauf Results over the Years
Every year, the Residenzlauf in Würzburg presents an exhilarating opportunity to challenge myself and revel in the joy of running 10km.
The Annual Tradition
For me, participating in the Residenzlauf has become an annual tradition—a cherished opportunity to test my limits, celebrate achievements, and foster a sense of community. Each year brings its own set of challenges and triumphs, contributing to a set of new memories and experiences.
An Idea Takes Shape
Inspired by the spirit of the event and fueled by my passion for data analysis, I embarked on the project—to visualize the collective race results over the years. Drawing on my expertise in Python and data visualization techniques, I set out to create a comprehensive visualization that would encapsulate the essence of the Residenzlauf across multiple years.
Insights Across the Years
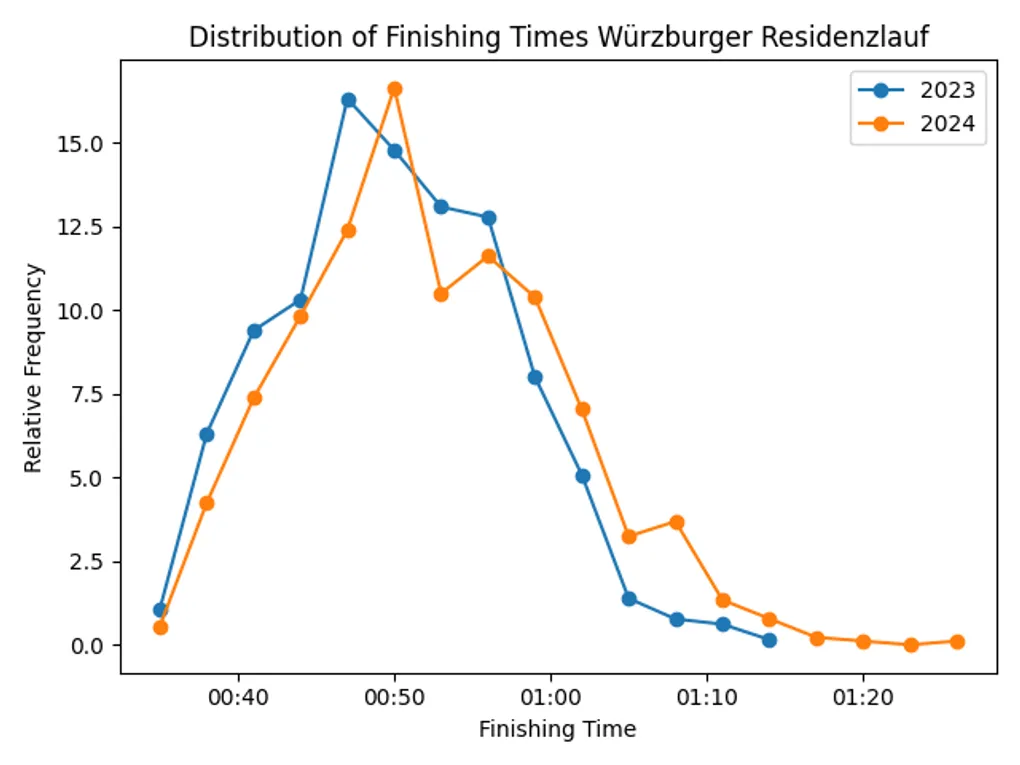
Using the Python libraries pandas and matplotlib, I created a unified view of the Residenzlauf’s results over time. The resulting visualization offers a captivating glimpse into the Residenzlauf’s journey over the years. By plotting the collective race results from multiple editions of the event on a single graph, patterns, trends, and fluctuations emerge, providing valuable insights into the race’s dynamics and participants’ performance.
A Tribute to Tradition
More than just a data visualization project, this endeavor serves as a tribute to the enduring legacy of the Residenzlauf and the unwavering spirit of its participants. It is a testament to the resilience, determination, and camaraderie that define the event year after year.
Looking Ahead
As I reflect on this year’s Residenzlauf and the journey of creating this visualization, I am filled with a sense of gratitude for the opportunity to participate in such a memorable event, and anticipation for the adventures that lie ahead in the next edition.
In the spirit of continuous improvement and exploration, I am already looking forward to next year’s Residenzlauf—a chance to push my boundaries, celebrate achievements, and further refine my data visualization skills.
Here’s to many more miles, memorable moments, and meaningful insights along the way. See you at the finish line!