Solving the Transport Problem with the Stepping Stones Algorithm
I’m thrilled to share insights into a university project I’ve done focusing on visualising the Stepping Stone Algorithm, an algorithm to solve the famous Transport Problem.
Contents
- What is the Transport Problem?
- What is the Stepping Stones Algorithm?
- Motivation
- Features and Usage
- Demo and Code
What is the Transport Problem?
The Transport Problem is (in mathematics and economics) a study of optimal transportation and allocation of resources. The general idea goes like this: suppose there are 5 mines mining ore and 5 factories that need the ore. The quantities produced and needed (supply and demand) don’t match 1:1, therefore each mine can’t just supply the nearest factory.
The problem is solved when the quantities from every source are allocated, each destination receives the quantity requested and the costs are the lowest they can be.
What is the Stepping Stones Algorithm?
The Stepping Stones Algorithm is a way to solve the Transport Problem. It can be represented visually in a table, writing the supply quantities leading the rows and the demands in the header. The first step to solve it is to create a possible solution by filling the table with values. This can be done with many different methods including the Matrix-Minimum, North-West Corners, and Rows and Columns. Once it is filled, alternative paths with unused cells are calculated and the table is updated if they’re cheaper.
This article and this video provide much better and in-depth explanations.
Motivation
In class we learnt to solve this algorithm by hand and the professor challenged us to create a script to solve it. Being graphical wasn’t a requirement but I figured out it would help understand better what the program does. I was thinking of doing it as a web application using javascript, the language I’m currently using the most. But I realised it was overkill to create such a program. I decided to create with python but the only experience I have creating interactive programs is with Tkinter which is fine at best.
I’ve knew about pygame but had never had the chance to use it. I decided to learn it for this project as it allowed me to create the program completely to my liking.
Features and Usage
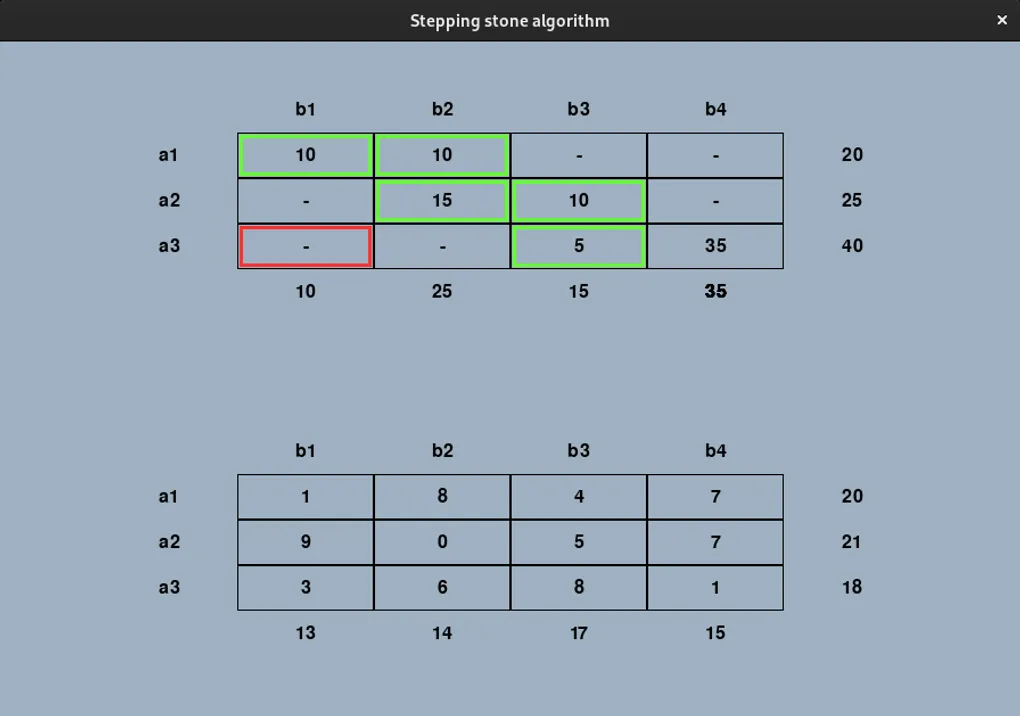
The interface of the project consists of two main components: the quantity table and the cost table. Users can edit the values in these tables by clicking on the cells. Then the program takes over and help them solve the problem with 2 modes:
-
Manual Mode: Right-clicking on a cell in the quantities table marks it as the starting point for calculation. The algorithm will then find possible paths from this cell. Press ‘u’ to update the table with the cheapest path calculated.
-
Auto Mode: Pressing ‘a’ will start this mode. It will calculate the costs for every possible path from every cell, updating the table when a cheaper one is found until the costs can’t be reduced further.
Demo and Code
Here is a short demo of the program:
Want to try it out for yourself? Check the project out on GitHub.